
Are you aware of the recent video marketing statistics?
They are mind-blowing!
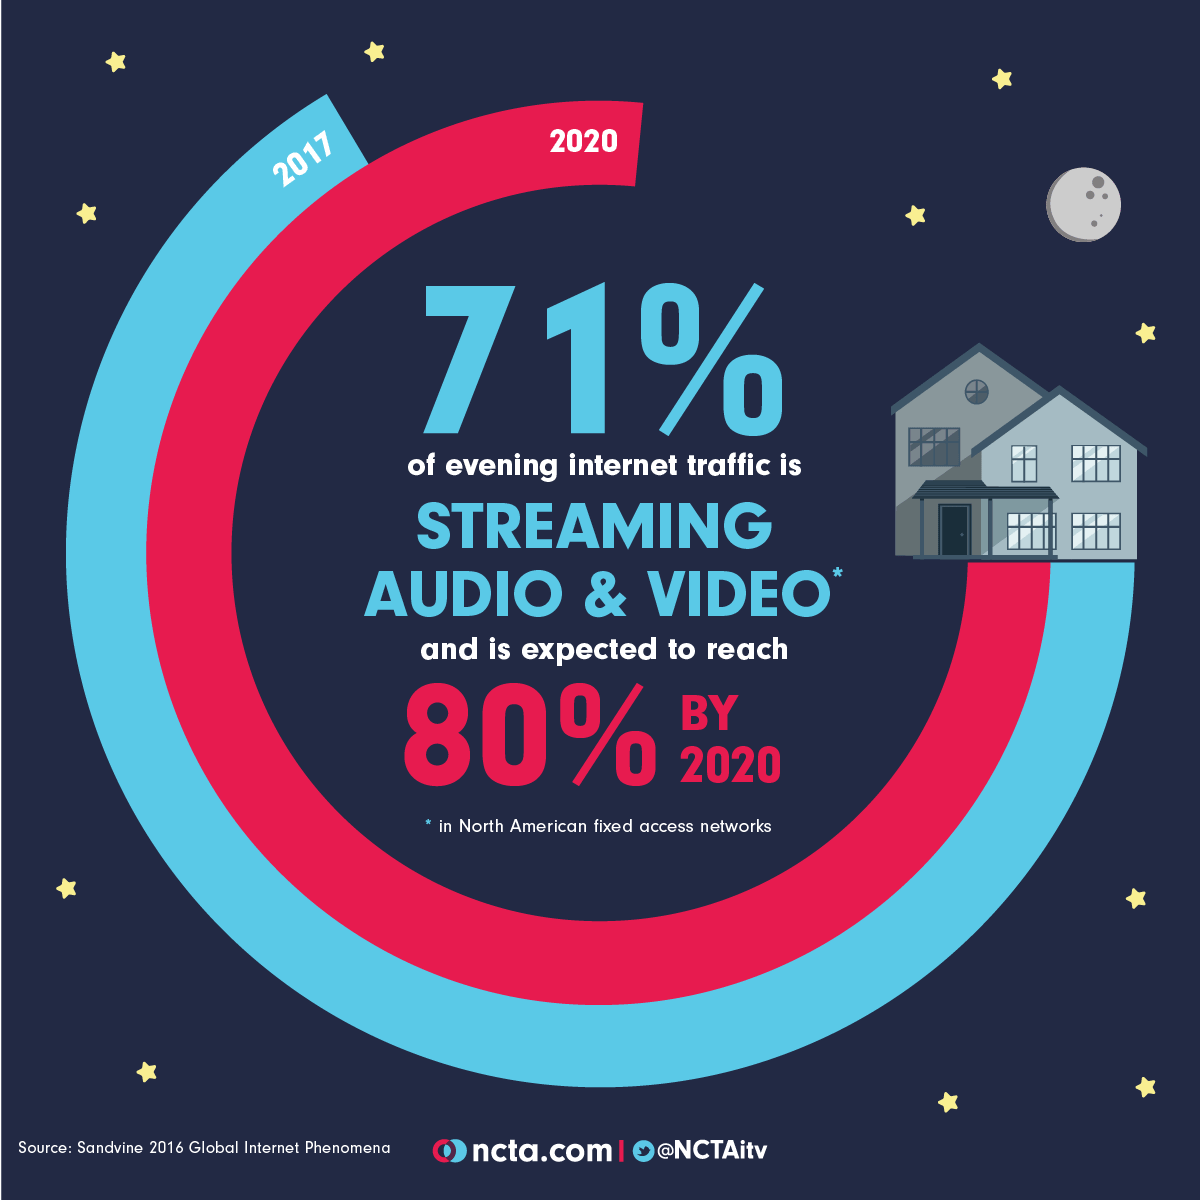
During the last few years, video marketing and video as a format developed at a light speed. Video marketing now takes market shares away from traditional TV and other adjacent marketing channels.
The power of video marketing is impressive.
Businesses of all sizes cannot afford to ignore this marketing channel anymore. So, make sure you consider leveraging this opportunity for the benefit of your business.
In this article we researched and gathered 100+ breathtaking video marketing stats, facts, and trends to shed more light on it for you.
General (Shocking) Video Marketing Statistics & Facts
1. Globally 25% of people watch online videos every day.
2. 1/3 of all online activity is spent watching videos.
3. 65% of users watch more than 3/4 of a video.
4. 87% of internet users in the U.S. watch online videos. (69% prefer to watch short videos.)
5. Video content uploaded in a single month is more than all three main U.S. TV networks combined have produced in 30 years.
Most Popular Video Streaming Platforms by Monthly Average Users in Millions (US, 2019)
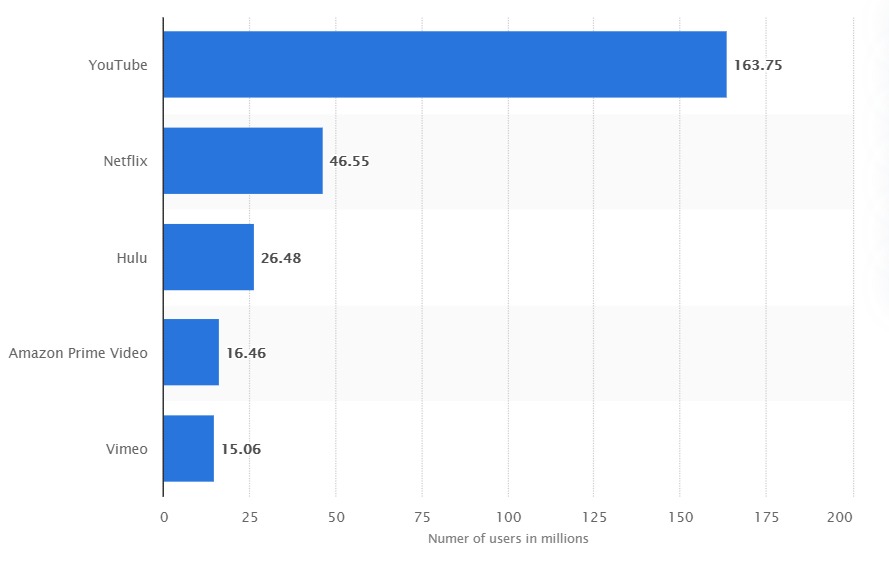
6. 45.5% of all internet users watch at least one online video per month.
7. The average internet user is exposed to an average of 32.2 videos within a month.
8. Viewers retain 95% of a message when they watch a video, as compared to 10% when they’re reading it in text.
9. 45% of viewers will stop watching a video after 1 minute.
10. 60% by 2 minutes.
11. 4 out of 5 users won’t wait and will click away if a video doesn’t load immediately.

of users will watch your video only if it loads instantly.
RELATED: Mobile Marketing Statistics
YouTube Video Statistics
12. YouTube has over a billion users. This is almost a third of all Internet users. On top of that, YouTube is the second largest search engine on the web.
13. 400 hours of video is uploaded to YouTube every single minute.
14. YouTube videos reach more 18-34 and 18-49 year-olds compared to any cable network in the United States.
15. YouTube is the most popular online video property in the United States (March 2018):
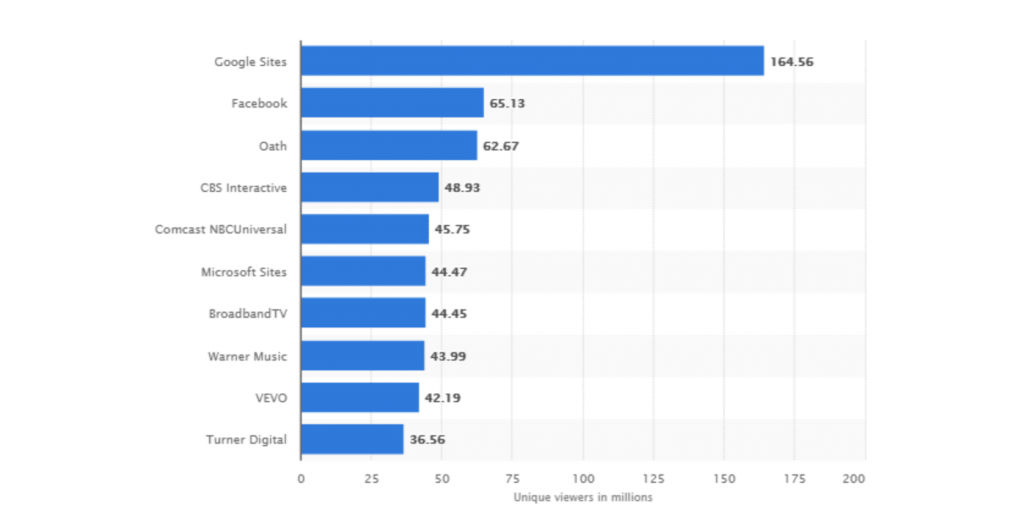
Source: Statista
16. YouTube users on average watch more than 30 billion hours of video per month.
17. And 1 billion hours every day.
18. 80% of views on YouTube are from outside of the U.S.
What percentage of video views on YouTube come from mobile devices?
More than 50%!
19. The average mobile viewing session on YouTube is more than 40 minutes.
20. 62% of mobile users discover videos through YouTube.
21. 25% of shoppers admitted that they’ve used YouTube to search for a video related to a product they’re considering in-store.
22. 16% of videos on YouTube are linked, shared, and embedded on Tuesdays between 11 am and 1 pm.
23. 67% of Millennials can find a YouTube video on everything they want to learn.
24. 60% of people prefer online video platforms (e.g. YouTube) to live television.

Source: Google/comScore custom survey, U.S., January 2016
25. In a standard month, 80% of 18 to 49 year olds watch YouTube.
26. YouTube time on TV has more than doubled year over year
27. YouTube is available in 76 different language versions (this covers 95% of the whole Internet population).
28. “How-to” searches are growing 70% year over year on YouTube.
29. 78.8% of marketers consider YouTube as the most effective platform for video marketing.
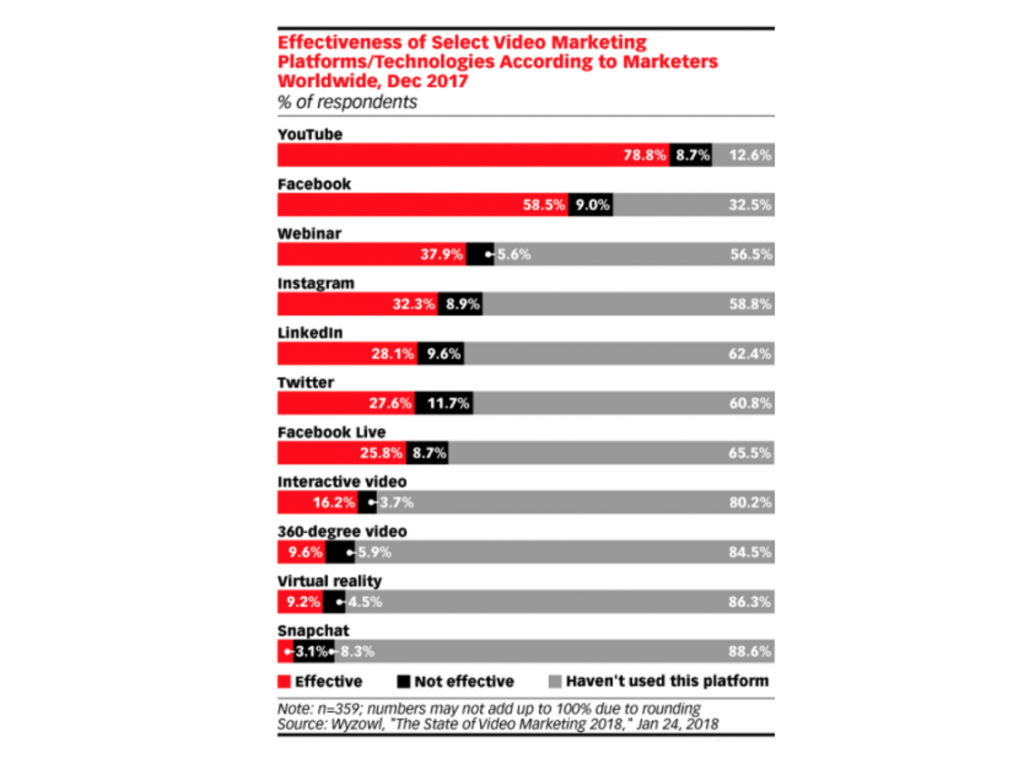
Source: eMarketer
YouTube Ad Stats
30. YouTube ads are on the rise. They currently constitute 27% of all online video ad spending in the United States:
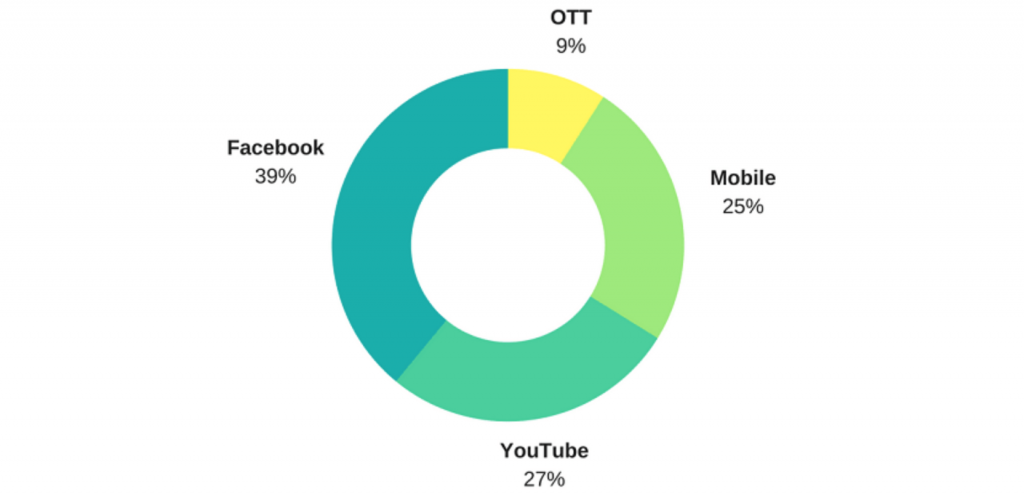
Source: eMarketer
31. On top of that 62% of marketers plan to increase their budget even more in 2018.
32. Accordingly, YouTube ad revenues are also on the rise:
YouTube Net Ad Revenues (US)
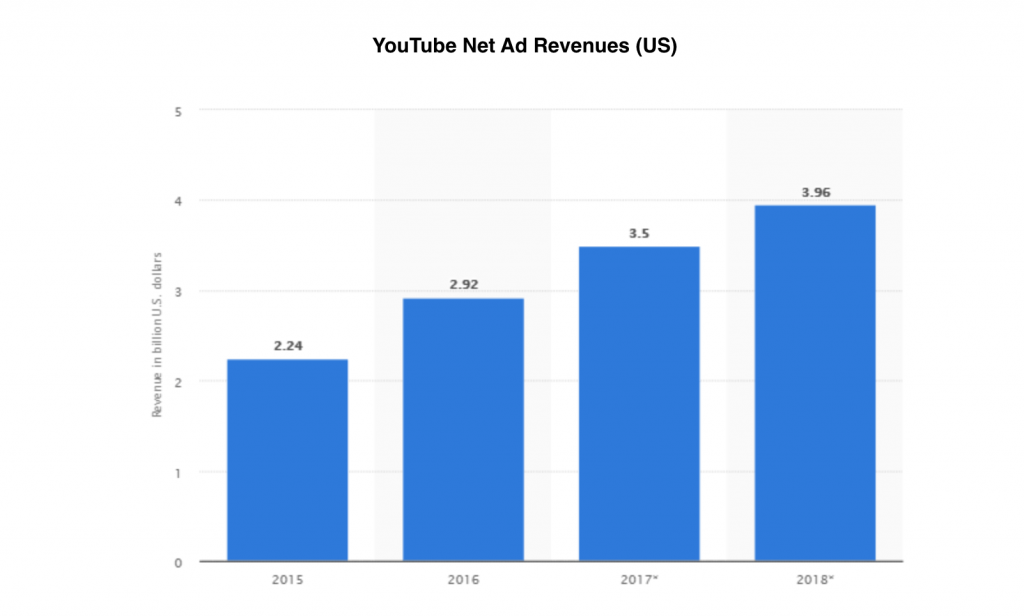
Source: Statista – U.S. net advertising revenues of YouTube 2015-2018
33. YouTube’s top 10 ads received 539 million views (14 hours watch time) and 3.6 million likes in 2017.
34. Between 2017 and 2018 the total number of small and medium-sized businesses advertising on YouTube grew 2x times.
35. YouTube mobile advertising receives 62 percent of attention while this figure for TV ads is only 45 percent.
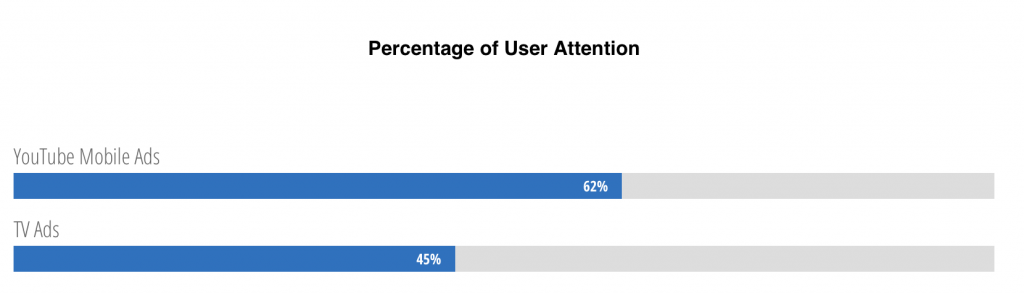
36. YouTube mobile ads (paid) have 84 percent more chances to get attention compared to TV ads.
37. 73 percent of TV viewers are disappointed by the amount of TV ads. This is not the case with YouTube ads.
38. TV viewers multitask more than mobile YouTube viewers during ads:
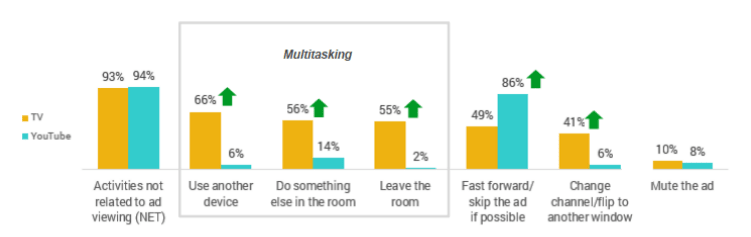
Source: Ipsos/Google Advertising Attention Research
39. Currently, 95% of YouTube ads are audible and 93% are viewable. The best results are achieved when ads are both audible and viewable.
40. 95% of YouTube ads are watched with the sound turned on.
Facebook Video Statistics
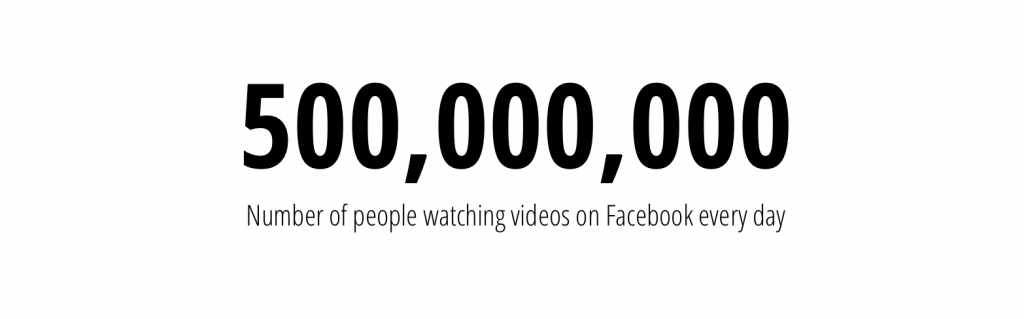
41. Facebook users generate 8 billion video views per day.
42. More than 500 million people watch more than 100 million hours of video every day on Facebook.
43. 85% of Facebook video is watched on mute mode.
44. Almost half of the pages (47%) don’t post videos on Facebook.
45. In a study conducted by LocoWise 12 brands uploaded 46% of all videos on Facebook.
46. On average people watch only a third of a video on Facebook.
47. 41.3% of pages promote their videos with paid ads on Facebook.
48. 80% of users get pissed off and react negatively toward videos (and publishing brands) when sound auto-plays unexpectedly loud.
49. Almost half of Facebook users find it easier to watch videos on a smartphone compared to computer.
50. One-third of users admit that seeing the logo of a favorite brand can get them to stop scrolling and watch the video.
51. Every fifth video is now a live broadcast on Facebook.
52. Live videos on Facebook get 3x more watching time.
🔔 Related: Facebook Live Statistics
Mobile Video Marketing Stats & Facts
53. Mobile video consumption increases 100% every year.
54. Mobile video views grew 6x faster than desktop views in 2015.
55. Only 18% of users watch video through browsers.
56. 48% of mobile users watch video using mobile apps.
57. 33% through social media.
58. 20% search results.
59. And only 14% through advertising.
60. Mobile video budgets are rapidly rising (18% for 2014 – 2015).
61. Mobile shoppers are three times (3x) more likely to view a video compared to desktop shoppers.
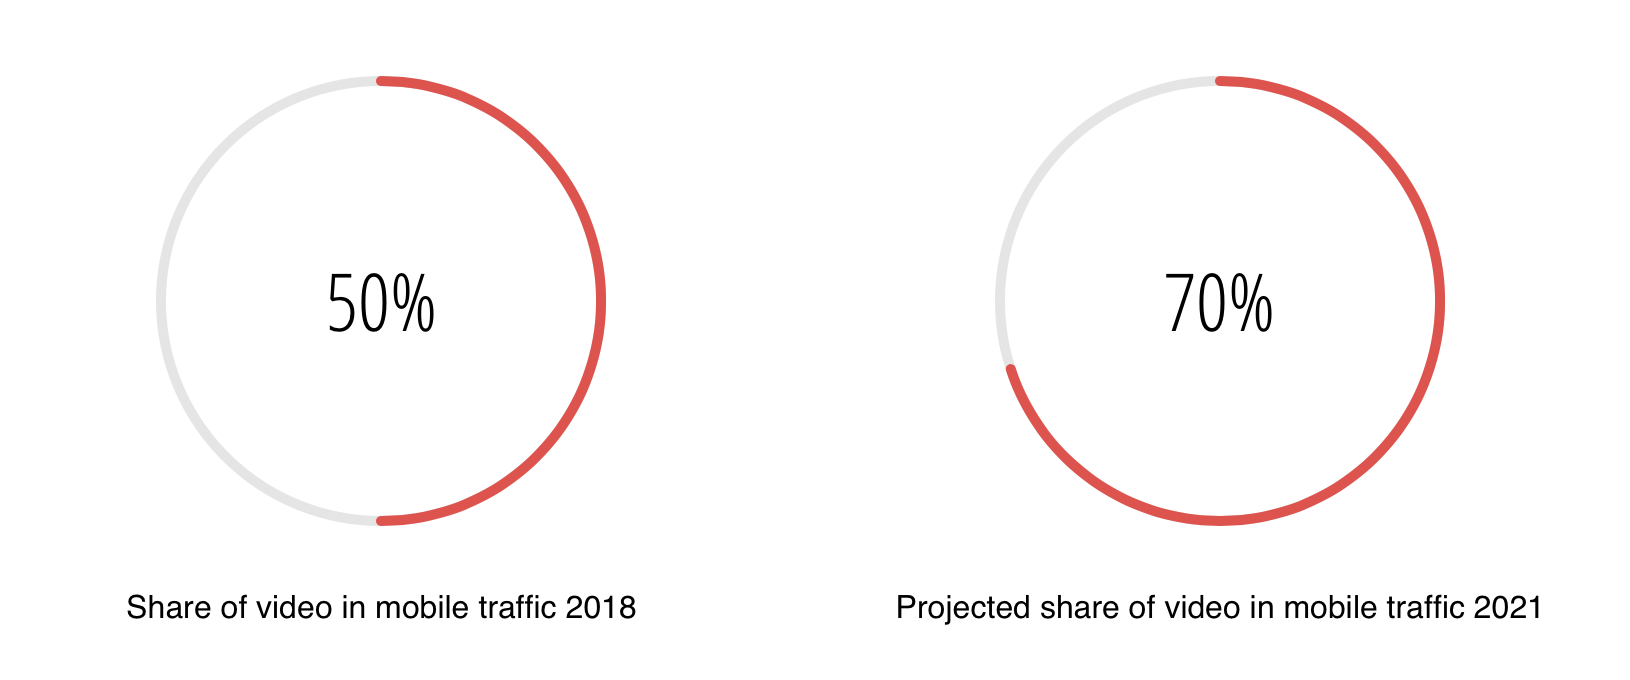
62. Video now accounts for more than 50% of all mobile traffic and will account for 70% of all mobile traffic by 2021.
Video Marketing and Video Advertising Statistics for Marketers
63. Video viewers are 1.81 times more likely to buy a product than non-viewers.
64. 80% of users will watch a video and only 20% will read your content in full.
65. Videos tend to increase user’s understanding of product or service by 74%.
66. 90% of internet users consider a video about product or service helpful in making a decision.
67. Videos increase landing page conversions up to 80%.
68. Video instead of an image on a landing page increases conversions by 12.62%.
69. Marketers using video grow revenue 49% faster than others.
70. 82% of marketers confirmed that video marketing had a positive impact on their business and helped them with better lead generation.
71. Video within an email doubles or triples the Click-Through Rates (CTR).
72. Video makes Email Marketing Campaigns 51% more effective.
73. Video on the homepage can boost conversion rates by 20% or even more.
74. 75% of executives at least once a week watch work-related videos on business websites.
75. 65% of them visit the website.
76. And 39% call a vendor after watching the video.
77. 59% of executives prefer to watch video instead of reading text.
78. 96% of B2B organizations utilize video to some extent in their marketing efforts.
79. 73% of them report positive changes in ROI.
80. 25% of consumers lose interest in a company if it doesn’t use videos.
81. 56% of them believe that if a company has a website, it should have also videos.
82. Usually, the average internet user spends 88% more time on a site with video.
83. Digital marketers using video get 41% more search traffic compared to marketers who do not use video.
84. 51.9% of marketing professionals globally consider video as the type of content with the best ROI.
85. 64% of consumers prefer visual content over customer service.
86. 62% of consumers are more likely to have a negative perception of a brand that published a poor-quality video experience.
87. 50% of marketers are shifting budgets from TV to digital video.
88. The word “video” in an email subject line increases open rates by 19%.
89. Boosts CTR by 65%.
90. And reduces unsubscribes by 26%.
91. Explainer videos boost conversion rates by 20%.
92. 22% of all U.S. small businesses are planning to post a video within next 12 months.
93. 60 seconds of video equal to 1.8 million words according to Forrester researcher Dr. James McQuivey.

Video Advertising Statistics
94. 35% of total online ad budget is spent on video ads.
95. 65% of U.S. marketers consider increasing their mobile video ad budgets.
96. Every month an average internet user watches 16 minutes 49 seconds of video ads.
97. Mobile users watch vertical video ads nine times more than horizontal ones.
98. 80% of users recall the video ads they have seen in the past 30 days.
99. 26% of users will look for additional information after watching a video ad.
100. 22% of them will visit the link provided or website mentioned in a video ad.
101. And 12% of users will actually buy the particular product featured in the video ad.
102. The probability of making the online sale is 64% higher when your users watch video(s).
103. 36% of users trust video ads.
104. At least some sort of action is taken by 46% of users after viewing a video ad.
105. The average CTR of video ads is 1.84%. This is the highest CRT among all digital ad formats.
Social Media Video Statistics
106. 92% of mobile video consumers share videos with others.
107. 15 seconds or shorter videos get 37% more shares compared to those between 30 and 60 seconds.
108. Awesome video ads driving excitement increase purchase intent by 97%.
109. And brand awareness by 139%.
110. The most popular form of online video content among all users is comedy at 39%.
111. The second is news at 33%.
112. Followed by music at 31%.
113. Around 100 million hours of video watched every day on Facebook.
114. 90% of Twitter video views are on mobile devices.
115. 82% of Twitter users watch video content on Twitter.
116. Snapchat users watch 10 billion videos per day.
117. Snapchat surpassed Facebook in video views first time in 2016 (10 billion video views per day versus 8 billion video views per day).
118. Every month on average 200 million video ads are shown on Instagram.
119. 9 out of 10 Instagram shares happen on Facebook.
120. 9.3 million live streams happen monthly on Periscope.
121. Average daily volume of video on Periscope is 350,000 hours.
122. Total number of active Periscope users is around 1.9 million.
Future of Video Marketing
123. To watch every video that will be crossing global IP networks in one month in 2020, you will need to spend full five million years.
124. Internet video to TV grew 50% in 2015. It will continue to grow, increasing 3.6-fold by 2020.
125. 79% of all global consumer web traffic will come from video by 2018.
126. In 2020, video will constitute 23.2% of marketing spend, compared to 17.7% in 2015.
127. Mobile video will increase 11x between 2015 and 2020.
128. By 2020, over 75% of global mobile data traffic will be video content.
129. 7 trillion video clips will be uploaded in 2020 – 2.5 daily video clips for every person.
Video Engagement Statistics and Additional Facts On Video Marketing
130. Shorter videos get higher engagement rates:
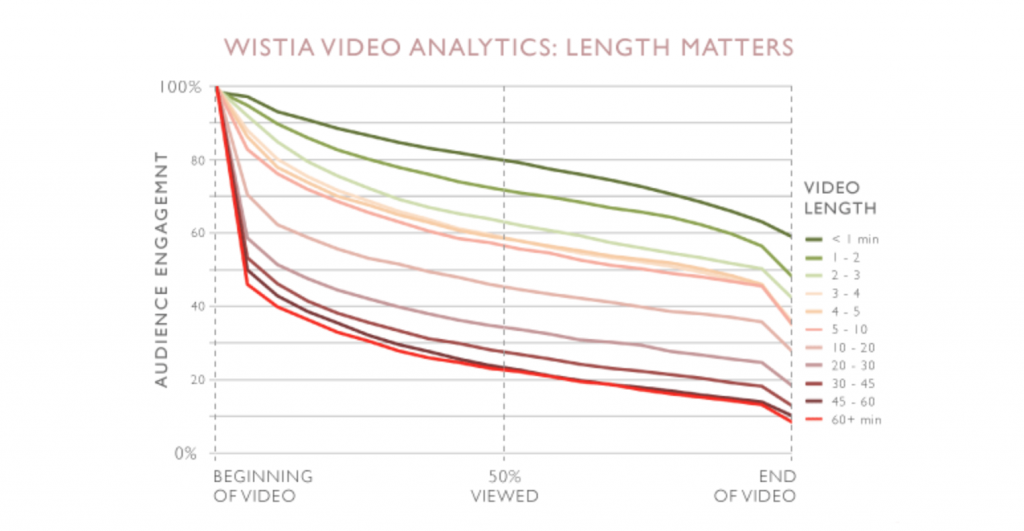
Source: Wistia
131. IPad users tend to watch a video for up to 5 minutes long.
132. 33% of users watch one hour of video every day on their tablets.
134. Video on social media gets shared 1200% more compared to text and images.
135. In December 2013 188.2 million Americans watched 52.4 billion online videos (content only) in one month.
136. Real estate listings including a video tend to get 403% more inquiries.
137. 42% of videos on UK Newspaper Sites are ads.
138. Vimeo tracks 715 million video views on average per month.
Now, after you know all these video marketing facts and all those stats on video marketing, are you still asking yourself whether using video marketing is a good idea for your business? 😉
Sources
Sources
- http://images.forbes.com/forbesinsights/StudyPDFs/Video_in_the_CSuite.pdf
- http://www.marketwired.com/press-release/a-minute-of-video-is-worth-18-million-words-according-to-forrester-research-1900666.htm
- http://www.reelseo.com/2013-video-marketing-business-survey-trends-report/
- http://www.marketingpilgrim.com/2014/12/in-the-next-60-seconds-300-hours-of-video-will-be-uploaded-to-youtube.html
- http://www.prnewswire.com/news-releases/animoto-survey-consumers-want-more-video-marketing-on-web-social-and-email-300079377.html
- http://www.cisco.com/c/dam/en/us/solutions/collateral/service-provider/visual-networking-index-vni/complete-white-paper-c11-481360.pdf
- https://blog.twitter.com/2015/new-research-twitter-users-love-to-watch-discover-and-engage-with-video
- https://www.thinkwithgoogle.com
- http://www.businessinsider.com/digital-video-advertising-growth-trends-2014-5
- http://go.brightcove.com/en-highcostoffree
- http://www.statista.com/statistics/259477/hours-of-video-uploaded-to-youtube-every-minute/
- https://www.statista.com/statistics/910875/us-most-popular-video-streaming-services-by-monthly-average-users/
- http://www.business2community.com/infographics/23-reasons-to-use-video-marketing-in-2015-infographics-01305360#3fwKvMwlGjdQKQ34.97
- http://www.tnsglobal.com/press-release/connected-life-tv-press-release
- https://www.recode.net/2016/1/27/11589140/facebook-says-video-is-huge-100-million-hours-per-day-huge
- https://www.facebook.com/business/news/updated-features-for-video-ads
- https://www.facebook.com/iq/articles/moving-pictures-the-persuasive-power-of-video#
- https://www.facebook.com/iq/articles/shifts-for-2020-multisensory-multipliers
- https://dustn.tv/social-media-statistics/
- comScore
- Adobe
- Vidyard
- EyeView
- Sandvine
- Google data, global, Q4 2015
- Google-commissioned Nielsen study, Nielsen National Total Media Fusion, U.S., Q4 2015
- Google Data, Q1 2014–Q1 2015, U.S.
- YouTube Global Internal Data, Global, 2016
Further reading:
I see loads of videos being shared online. It’s a good way to advertise products and services these days.